
Scientific Book

Glycemic variability and alterations preceding diabetes

Glucose regulation depends on the interaction between insulin secretion by pancreatic β-cells, hepatic insulin clearance, and tissue sensitivity to the hormone. Glycemic variability, hyperinsulinemia, and insulin resistance describe different but closely linked phenomena that can manifest before evident changes in glycemia. In the book "The Choice to Live in Health or Disease," Dr. A. Colonnese and R. Panzironi analyze these mechanisms to understand the evolution of metabolic alterations and their implications for health.

Cite this article
Colonnese, A. & Panzironi, R. (2026). Glycemic variability and alterations preceding diabetes. The Choice to Live in Health or in Disease. https://lifesciencehub.info/en/la-scelta-di-vivere-in-salute-o-in-malattia/glycemic-variability-and-alterations-preceding-diabetes
The Choice to Live in Health or in Disease · ISBN 979-12-82692-03-8

DOI lsh.en.libro.3

  • Published 05/11/2026
  • Updated 05/11/2026
  • GLYCEMIC VARIABILITY
  • Β-CELL FUNCTION
  • HEPATIC CLEARANCE
  • HYPERINSULINEMIA
  • INSULIN RESISTANCE
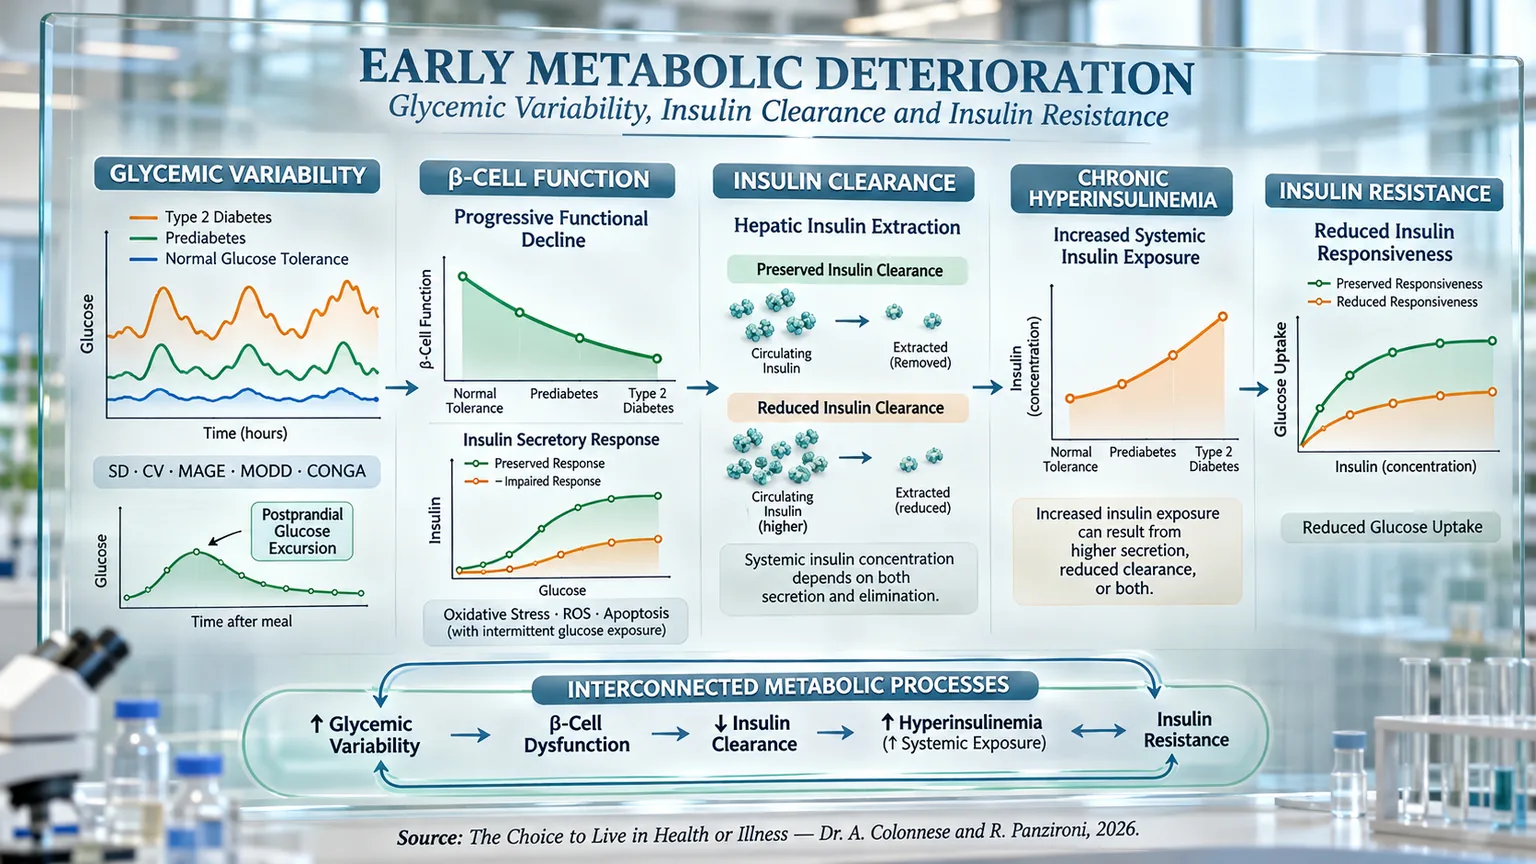
Scientific panel with five sections, charts, and arrows between glycemic variability, beta-cell function, insulin clearance, hyperinsulinemia, and insulin resistance.
The infographic connects "Glycemic Variability," the decline of "β-Cell Function," reduced "Insulin Clearance," "Chronic Hyperinsulinemia," and "Insulin Resistance": charts on postprandial excursions, secretion, hepatic extraction, and glucose uptake describe interconnected metabolic processes that can anticipate diabetes, before evident glycemic alterations, and feed into one another.

ABSTRACT

Metabolic deterioration can precede the onset of overt hyperglycemia by years, through interconnected alterations in glycemic variability, pancreatic function, and insulin metabolism. In the book "La scelta di Vivere in Salute o in Malattia" (The Choice to Live in Health or Disease), Dr. A. Colonnese and R. Panzironi analyze these processes, highlighting the limitations of an assessment based exclusively on conventional glycemia.

Continuous glucose monitoring allows for the description of glycemic oscillations using indicators such as SD, CV, MAGE, MODD, and CONGA. Greater variability, especially postprandial, can manifest before overt diabetes and be associated with oxidative stress, inflammation, endothelial dysfunction, and vascular complications. Even elevated blood glucose one hour after an OGTT can identify early alterations in β-cell function and insulin sensitivity.

Pancreatic secretory capacity must be interpreted in relation to tissue sensitivity, considering parameters such as the disposition index. Experimental studies also indicate that intermittent glucose oscillations can accentuate ROS production, lipid peroxidation, and β-cell apoptosis compared to conditions of stable hyperglycemia. In parallel, systemic insulin concentration depends not only on pancreatic secretion but also on hepatic clearance. A reduction in this clearance can precede significant secretory increases and is associated with adiposity, hepatic steatosis, and metabolic risk.

Hyperinsulinemia therefore emerges as a phenomenon potentially resulting from increased secretion, decreased elimination, or both. Persistent insulin exposure can also attenuate cellular response through alterations of the insulin receptor and IRS-1/PI3K/AKT signaling, contributing to a possible reciprocal circuit with insulin resistance.

The progression of this clinical picture does not necessarily follow a uniform sequence: the relative contribution of secretion and clearance varies with metabolic conditions, while pancreatic function can deteriorate progressively over time. This perspective integrates glycemic variability, β-cell deterioration, and insulin clearance into a dynamic process, suggesting the importance of recognizing metabolic alterations early before diagnostic thresholds of hyperglycemia are reached.

Before obvious glycemic alterations or a diagnosis of diabetes appear, metabolic balance can begin to shift in much more subtle ways. In fact, glycemia is merely the final result of a complex regulatory network involving insulin secretion, the ability of pancreatic β-cells to adapt to the body's demands, the sensitivity of tissues to insulin, and the rate at which this hormone is cleared from circulation. To truly understand how hyperinsulinemia, insulin resistance, and, subsequently, the loss of glycemic control develop, it is therefore necessary to observe not only how much glucose is present in the blood, but also how it fluctuates over time and which mechanisms allow the body to maintain it within physiological limits.

In this perspective, glycemic variability and postprandial excursions take on particular importance, as they can reveal a deterioration in metabolic regulation early on, even when average values still appear normal. At the same time, it becomes essential to understand the role of pancreatic β-cells, whose ability to adapt insulin secretion to the body's needs largely determines the maintenance of glucose homeostasis. Insulin clearance, especially hepatic, also contributes to this balance by regulating the amount of hormone actually available to peripheral tissues.

Taken together, these processes allow us to move beyond a simplistic view in which increased glycemia, hyperinsulinemia, and insulin resistance represent isolated or rigidly sequential events. Rather, they constitute interdependent components of a dynamic system in which initially compensatory alterations can progressively transform into mechanisms capable of fueling metabolic deterioration. The following paragraphs will therefore analyze this progression, starting from glycemic oscillations, moving through β-cell function and insulin clearance, and arriving at the bidirectional relationship between hyperinsulinemia and insulin resistance.

Glycemic variability

Glycemic variability describes the set of fluctuations in blood glucose concentration that occur throughout the day and between different days. Unlike mean glycemia or glycated hemoglobin (HbA1c), which provide a snapshot of metabolic control over the long term, glycemic variability reveals how stable or unstable glucose trends are during daily life. Two people can, in fact, have the same HbA1c value but profoundly different glycemic profiles: one with relatively constant levels and the other characterized by continuous hyperglycemic spikes followed by rapid drops in glycemia. This difference, invisible to HbA1c alone, is now considered increasingly important because it allows for the capture of aspects of metabolic regulation that escape traditional laboratory indicators (Færch et al., 2018) [1]; (Rodbard, 2018) [10].

A certain oscillation in glycemia is naturally a physiological phenomenon. After every meal, glucose tends to increase, stimulating insulin secretion, before gradually returning to baseline values. In metabolically healthy individuals, this process occurs with great precision thanks to the efficient coordination between insulin secretion, tissue sensitivity to insulin, and hepatic glucose production. When these mechanisms begin to lose efficiency, the oscillations become progressively wider and more prolonged, appearing even in the phases preceding overt diabetes (Wang et al., 2012) [2]; (Chen et al., 2013) [9].

Modern Continuous Glucose Monitoring (CGM) technologies have revolutionized the study of this phenomenon. Unlike traditional point-in-time blood glucose measurements, CGM records hundreds of values over twenty-four hours, allowing for the observation of the entire daily glycemic profile, the identification of post-meal spikes, any hypoglycemia, nocturnal oscillations, and their repeatability in the following days. Numerous mathematical parameters are derived from these recordings, including the standard deviation (SD), which measures how much values deviate from the mean; the coefficient of variation (CV), which relates this dispersion to mean glycemia; the Mean Amplitude of Glycemic Excursions (MAGE), which quantifies the amplitude of the main glycemic excursions; the MODD, which evaluates variability between consecutive days; and other indices such as CONGA and HBGI, each capable of describing specific aspects of glycemic stability (Færch et al., 2018) [1]; (Rodbard, 2018) [10].

The importance of glycemic variability emerges clearly by observing how it evolves along the entire metabolic continuum. In a study conducted on 162 subjects monitored via CGM for three consecutive days, it was demonstrated that glycemic oscillations increase progressively as one moves from normal glucose tolerance to impaired glycemic regulation and finally to newly diagnosed type 2 diabetes. Already in subjects with prediabetes, the standard deviation, the maximum amplitude of glycemic excursions, and the MAGE were significantly increased compared to normoglycemic individuals, while in patients with diabetes, these alterations became even more marked, accompanied by greater postprandial excursions, higher nocturnal glycemic levels, and greater variability between consecutive days. The study also highlighted strong correlations between the different variability metrics, suggesting that they represent different manifestations of the same progressive deterioration of metabolic control (Wang et al., 2012) [2].

This progression appears closely linked to the worsening of pancreatic β-cell function. Some researchers studied 220 subjects distributed across the entire spectrum of glucose tolerance, from normoglycemia to overt diabetes, demonstrating that all indices of glycemic variability increase in parallel with the reduction of the oral disposition index, a parameter that integrates the secretory capacity of β-cells and insulin sensitivity. In other words, as the pancreas loses the ability to compensate for insulin resistance, glycemic oscillations become increasingly accentuated. All variability indices, including SD, MAGE, MODD, CONGA, and HBGI, showed a significant inverse correlation with the oral disposition index, indicating that the loss of β-cell function represents one of the main pathophysiological drivers of increasing glycemic instability (Chen et al., 2013) [9].

However, oscillations in glycemia do not only represent a consequence of metabolic deterioration but also seem to anticipate its onset. The prospective AEGIS study followed 497 initially non-diabetic subjects for six years, demonstrating that those who would subsequently develop diabetes already exhibited greater glycemic variability at the time of enrollment compared to participants who remained normoglycemic. Among all the metrics analyzed, the standard deviation proved to be the best predictor of the future onset of the disease. The coefficient of variation and the MAGE were also significantly associated with the future development of diabetes, suggesting that glycemic instability may represent a very early signal of the loss of glucose homeostasis (Rodríguez García et al., 2025) [6].

Interest in glycemic variability also stems from the fact that it may exert its own biological effects, independent of simple mean glycemia. Several experimental studies suggest that the continuous alternation between hyperglycemic spikes and sharp drops in glycemia favors a greater production of reactive oxygen species compared to stable hyperglycemia, promoting oxidative stress, endothelial dysfunction, activation of inflammatory processes, and alterations in platelet activity. In parallel, hypoglycemic episodes determine the activation of the sympathetic nervous system with the release of catecholamines, increased cardiac workload, and increased systemic inflammation. Although the independent contribution of glycemic variability compared to mean glycemia continues to be a subject of research, the body of evidence suggests that limiting such oscillations may represent an additional goal of metabolic control (Suh and Kim, 2015) [7]; (Zhou et al., 2020) [8].

Consistent with these mechanisms, numerous observational studies have associated high glycemic variability with a greater risk of microvascular and macrovascular complications. Wider oscillations are correlated with the progression of diabetic retinopathy, nephropathy, and neuropathy (the main pathologies linked to the diabetic condition), as well as a worse cardiovascular prognosis, greater arterial stiffness, carotid remodeling, heart failure, myocardial infarction, stroke, and increased all-cause mortality. Furthermore, glycemic variability represents one of the best predictors of the risk of severe hypoglycemia, often superior to HbA1c alone, confirming that metabolic control does not depend exclusively on the mean value of glycemia but also on its stability over time (Gerich, 2007) [3]; (Suh and Kim, 2015) [7]; (Zhou et al., 2020) [8].

Particularly interesting is the contribution of postprandial glycemic excursions. By analyzing data from the ADAG study, it was observed that in subjects without diabetes, post-meal glycemia represents the main glycemic determinant of HbA1c, whereas in type 2 diabetes, preprandial and postprandial glycemia contribute almost equally to overall glycemic control. Furthermore, the weight of glycemic factors in determining HbA1c increases progressively with the worsening of metabolic compensation, while in normoglycemic subjects, a significant portion of HbA1c variability continues to depend on biological factors not directly correlated with glucose levels (Færch et al., 2018) [1]. Similarly, a 2007 review emphasizes how postprandial glycemic spikes represent the predominant component of daily glycemic variability and how their monitoring can provide clinically relevant information not obtainable through fasting glycemia or HbA1c alone (Gerich, 2007) [3].

These insights have fostered the development of nutritional strategies specifically aimed at reducing glycemic oscillations. A randomized crossover study conducted on healthy young women demonstrated that dividing carbohydrate intake into five small daily meals, always consuming them after vegetables and proteins, significantly reduces MAGE, postprandial glycemic spikes, the incremental area under the glycemic curve, and the time spent above 140.4 mg/dL compared to the traditional three-meal pattern. Possible mechanisms include the reduction of the glycemic load of each meal, the slowing of gastric emptying induced by fiber, increased incretin secretion, and the so-called "second-meal effect," which improves the insulin response to subsequent meals (Higuchi et al., 2025) [4].

Similar results also emerge in patients with type 2 diabetes. In a twelve-week randomized clinical trial, researchers demonstrated that a diet rich in foods containing slowly digestible starch significantly reduces MAGE, standard deviation, coefficient of variation, CONGA, and MODD compared to a diet with rapidly digestible starch. The intervention was accompanied by high adherence, equal to 96%, and a trend toward better HbA1c control, indicating that simple changes in the quality of carbohydrates can contribute concretely to stabilizing the glycemic profile without requiring complex interventions (Chisbert et al., 2025) [5].

Taken together, this evidence indicates that the modern assessment of glucose metabolism can no longer be limited to mean glycemia alone. Understanding how much glucose oscillates during the day allows for the early detection of β-cell function deterioration, the identification of individuals at higher risk of developing diabetes, the estimation of the risk of complications, and the monitoring of the effectiveness of nutritional and therapeutic interventions with greater precision. Monitoring glycemic variability, therefore, does not replace fasting glycemia or HbA1c tests, but complements them, offering a much more dynamic and physiologically accurate view of metabolic control.

Postprandial glycemic variability

If glycemic variability describes glucose fluctuations throughout the day, its postprandial component likely represents the earliest manifestation of alterations in glucose metabolism. After a meal, the body is required to coordinate a complex physiological response involving gastric emptying, intestinal glucose absorption, incretin secretion, the rapid release of insulin by pancreatic β-cells, the inhibition of hepatic glucose production, and peripheral glucose uptake by muscles and adipose tissue. When even one of these mechanisms begins to lose efficiency, the first observable consequence is often an excessive glycemic excursion after a meal, while fasting glycemia may still remain perfectly normal (Tfayli et al., 2011) [11]; (Giosuè et al., 2026) [16].

In recent years, there has been growing attention toward the glucose concentration measured one hour after an oral glucose tolerance test (OGTT). Traditionally, the test is interpreted by considering only fasting glycemia and the measurement taken after two hours; however, numerous pieces of evidence show that this approach risks overlooking a significant portion of individuals who, despite still being normoglycemic according to conventional diagnostic criteria, already exhibit significant metabolic alterations. In particular, a one-hour glycemia equal to or greater than 155 mg/dL identifies a subgroup characterized by a significantly higher risk of progressing to type 2 diabetes, suggesting that pathophysiological alterations have already begun long before the onset of prediabetes diagnosed via traditional criteria (Jagannathan et al., 2016) [13]; (Nie et al., 2025) [15].

The first mechanism involved appears to be the progressive loss of the functional capacity of pancreatic β-cells. In a 2011 study conducted on young overweight and obese non-diabetic individuals, it was demonstrated that subjects with one-hour glycemia above the 155 mg/dL threshold exhibited a significantly lower disposition index compared to peers with lower values, regardless of their glucose tolerance classification. The disposition index, which integrates insulin secretion with insulin sensitivity, was also found to be the main determinant of one-hour glycemia, explaining about one-fifth of its variability. This means that an excessive postprandial glycemic excursion already reflects a reduced capacity of β-cells to adequately compensate for insulin demand, even when fasting and two-hour glycemia are still within normal limits (Tfayli et al., 2011) [11].

These observations have been confirmed in different populations. Some researchers compared subjects with normal glucose tolerance but elevated one-hour glycemia with individuals having normal one-hour glycemia and patients affected by impaired glucose tolerance (IGT). Although insulin sensitivity was substantially similar between the two normoglycemic groups, indices describing β-cell function, such as the oral disposition index and ISSI-2, were significantly reduced in subjects with elevated one-hour glycemia, reaching values practically identical to those observed in patients with IGT. In other words, subjects who were apparently healthy from a diagnostic standpoint already exhibited pancreatic function comparable to that of patients classified as prediabetic (Oh et al., 2015) [12].

A study conducted in a real-world clinical practice setting has further reinforced this concept. Researchers observed that subjects with normal glucose tolerance but glycemia above 155 mg/dL after one hour showed a significant reduction in insulin sensitivity and an impairment of β-cell function entirely similar to those found in subjects with prediabetes. The authors emphasize how approximately 40% of individuals who will develop diabetes initially present with normal glucose tolerance according to conventional criteria, and how the simple introduction of one-hour glycemia into the interpretation of the OGTT would allow for the early identification of many of these subjects, offering the opportunity to intervene when the metabolic damage is still reversible (Jagannathan et al., 2016) [13].

Even more solid evidence comes from an observational study involving over 9,400 individuals at risk for diabetes. Researchers demonstrated that nearly 40% of subjects classified as having normal glucose tolerance actually had a one-hour glycemia above 155 mg/dL. In this population, β-cell function was reduced by over 50%, while the decrease in insulin sensitivity was relatively more contained. Early insulin secretion showed marked impairment, and the glycemic and insulin curves were surprisingly similar to those observed in subjects with impaired fasting glucose. These data suggest that, at least in the initial stages of the disease, the loss of β-cell function may represent a predominant event compared to the onset of overt insulin resistance, making postprandial glycemia an extremely sensitive indicator of early metabolic deterioration (Nie et al., 2025) [15].

The importance of the postprandial glycemic response is further confirmed by modern continuous glucose monitoring technologies. Using CGM, a 2026 study identified three distinct glycemic response profiles after a standardized meal in patients with type 2 diabetes. The group characterized by the highest glycemic peaks and the slowest normalization of glycemia simultaneously presented reduced β-cell function and greater insulin resistance. Conversely, subjects with a more effective early insulin response showed a more rapid rise and fall in glycemia, a lower glycemic peak, and better pancreatic function. An aspect of particular interest is that these different profiles were not recognizable through common clinical characteristics, such as age, body mass index, or disease duration, but emerged clearly only by analyzing the dynamics of postprandial glycemia. This suggests that the glycemic curves obtained via CGM do not simply represent a recording of glucose levels, but constitute a true "metabolic signature" capable of reflecting the different underlying pathophysiological mechanisms and guiding increasingly personalized therapeutic strategies (Giosuè et al., 2026) [16].

The clinical importance of postprandial oscillations is further confirmed by a 2018 study, which aggregated data from five other phase III clinical trials. The authors observed that intra-day glycemic variability, of which postprandial excursions represent the predominant component, constitutes the main determinant of both glycated hemoglobin and average daily glycemia, regardless of the type of diabetes and the therapeutic regimen adopted. Furthermore, the reduction of intra-day variability was associated with better metabolic control and a lower risk of hypoglycemia, indicating that the stabilization of glycemic excursions after meals represents not only a physiological goal but also an important therapeutic target (Luo et al., 2018) [14].

Taken together, these findings profoundly change the way we interpret postprandial glycemia. More than just a simple value measured after a meal or during an oral glucose tolerance test, it represents a privileged window through which to observe the very first alterations in metabolic physiology. The increase in one-hour glycemia reflects the progressive loss of the ability of β-cells to respond promptly to the glucose stimulus and, subsequently, the increasing contribution of insulin resistance. Evaluating postprandial glycemic variability therefore allows for the identification of individuals who, despite still being normoglycemic according to traditional diagnostic criteria, already present with a profoundly altered metabolism and a significantly increased risk of developing type 2 diabetes and its complications in the following years (Tfayli et al., 2011) [11]; (Oh et al., 2015) [12]; (Jagannathan et al., 2016) [13]; (Nie et al., 2025) [15].

Glycemia and β-cell function

The relationship between glycemia and pancreatic β-cell function cannot be interpreted solely through the thresholds used to diagnose prediabetes and diabetes. In fact, glycemia does not rise suddenly the moment it exceeds a certain value; rather, it tends to change gradually as the systems responsible for its control lose efficiency. β-cells play a central role in this balance: they detect the increase in glucose and regulate insulin secretion so that hepatic production is contained and circulating glucose can be utilized by tissues. As long as this response remains adequate, glycemia can be maintained within apparently normal limits even in the presence of insulin resistance. When, however, insulin secretion is no longer proportional to metabolic needs, glycemic values begin to rise, initially slightly and subsequently until the onset of diabetes.

To correctly assess β-cell function, it is not enough to observe the absolute amount of insulin present in the blood. An insulin-resistant subject may produce much more than an insulin-sensitive person and still have an insufficient pancreatic response relative to their needs. Insulin secretion must therefore be interpreted in relation to the glycemic stimulus and insulin sensitivity. For this purpose, parameters such as the disposition index are used, which describes the pancreas's ability to compensate for insulin resistance. A reduction in this index indicates that β-cells are no longer able to adequately increase secretion, even when insulinemia (the concentration of insulin present in the blood at a given moment) still appears elevated.

The “San Antonio” metabolism study clearly showed that the deterioration of β-cell function spans the entire spectrum of glucose tolerance. By analyzing normotolerant subjects, people with impaired tolerance, and patients with type 2 diabetes, researchers observed a progressive inverse relationship between two-hour glycemia and pancreatic function. The decline was already evident among individuals who were formally normoglycemic: two-hour values between 101 and 119 mg/dL were associated with lower β-cell function compared to lower values, with further worsening between 121 and 139 mg/dL. The impairment then continued into glucose intolerance and reached maximum severity in overt diabetes (Gastaldelli et al., 2004) [17].

Normal glucose tolerance, therefore, does not represent a metabolically uniform condition. Two people with glycemia below the diagnostic threshold may possess very different β-cell reserves. One may respond rapidly to the glucose stimulus, while the other may have already lost a significant portion of their compensatory capacity. Glycemia is still classified as normal, but the pancreas may be forced to work under less favorable conditions and with progressively reduced margins of adaptation.

This pathophysiological continuity has also been observed in obese youth. In 407 children and adolescents with normal glucose tolerance, the increase in two-hour glycemia from values below 100 mg/dL toward values between 120 and 139 mg/dL was accompanied by a more pronounced early glycemic response. In the first thirty minutes of the OGTT, however, insulin secretion did not increase proportionally. This resulted in a progressive reduction of the insulinogenic index (which measures the pancreas's ability to increase insulin secretion in response to rising glycemia), present even when participants were compared at the same level of insulin sensitivity. This indicated that the impairment of the β-cell response was not simply a consequence of insulin resistance, but a functional alteration recognizable already within normoglycemia (Yeckel et al., 2005) [18].

The early phase of insulin secretion is particularly important because it limits the rise in glycemia immediately after glucose enters the circulation. A rapid release of insulin helps suppress hepatic glucose production and prepares peripheral tissues to utilize the glucose coming from the meal. When this response becomes weak or delayed, glycemia rises more rapidly. The pancreas may attempt to compensate through more prolonged secretion, but the delayed response does not always succeed in completely correcting the initial excursion.

The relationship between fasting glycemia and pancreatic function confirms this phenomenon. In 531 non-diabetic Japanese and Mexican-American subjects, insulin secretion was assessed via C-peptide (an indicator of pancreatic insulin production), reducing the influence exerted by hepatic insulin clearance. In participants with normal glucose tolerance, the disposition index decreased exponentially with the increase in fasting glycemia between 70 and 125 mg/dL. Each 28 mg/dL increment was associated with a 63% reduction in β-cell function corrected for insulin resistance. The deterioration primarily affected the secretion of the first thirty minutes, while the late phase did not show a significant relationship with basal glycemia (Abdul-Ghani et al., 2008) [19].

Even apparently modest glycemic variations can therefore reflect much broader functional alterations. Glycemia represents the final result of the interaction between hepatic production, peripheral utilization, insulin secretion, insulin sensitivity, and other regulatory mechanisms. When it begins to rise, even while remaining in the non-diabetic range, it may indicate that a portion of the pancreatic reserve has already been lost.

A study of 527 subjects with normoglycemia and normal glucose tolerance documented a reduction in β-cell function of up to approximately 40% in a portion of the participants. The impairment was associated with age, body weight, BMI (a parameter that relates weight and height), visceral fat, waist circumference, triglycerides, and cholesterol. Glycemia during the OGTT was also inversely correlated with pancreatic function. The product of fasting glycemia and one-hour glycemia showed the best ability to identify β-cell dysfunction, while one-hour glycemia above 110 mg/dL was associated with an almost sevenfold greater probability of presenting functional impairment (Vilchis-Flores et al., 2019) [20].

The vulnerability of β-cells thus fits into a context in which age, adiposity, lipid profile, and nutritional load interact. The accumulation of visceral fat increases insulin demand and is accompanied by a less favorable metabolic environment, while excessive energy availability can subject the pancreas to persistent stimulation. These observational data do not necessarily prove a direct causal relationship, but they show that the loss of pancreatic efficiency can be present long before diagnosis.

The weight of β-cell dysfunction appears particularly evident in populations of Indian Asian origin, in whom diabetes can appear at a young age and with relatively contained levels of adiposity. In a study of 1,264 subjects without known diabetes, the oral disposition index was reduced by 38% in isolated fasting hyperglycemia and by 32% in isolated glucose intolerance compared to normal tolerance. Variations in insulin resistance were, however, more modest. Even after correction for age, sex, BMI, waist circumference, and family history, β-cell function remained the parameter most associated with mild dysglycemia (Staimez et al., 2013) [21].

Similar results were obtained in young Indian Asians with prediabetes or early-onset type 2 diabetes. In diabetic patients, the oral disposition index was almost ten times lower compared to normotolerant controls. In prediabetes, both reduced insulin sensitivity and pancreatic impairment contributed; in overt diabetes, however, only β-cell function maintained a significant independent association (Mohan et al., 2013) [22].

Insulin resistance naturally retains an important role, as it increases the amount of insulin required to obtain the same biological response and therefore the work required of the pancreas. However, it does not inevitably lead to hyperglycemia. Many people remain normoglycemic because their β-cells manage to adequately increase secretion. Progression toward diabetes depends to a large extent on the ability to sustain such compensation over time.

This interpretation was confirmed in a longitudinal study of 302 normoglycemic women three months after childbirth. Over the following five years, 89 developed prediabetes or diabetes. These women initially presented with greater adiposity, insulin resistance, and already reduced pancreatic function, but the main predictor of progression was the continuous deterioration of the ISSI-2, an index that integrates insulin secretion and sensitivity. Its predictive contribution was much higher than that of HOMA-IR, the Matsuda index, BMI, and waist circumference (Retnakaran et al., 2023) [23].

The debate remains open regarding the initial order of events. The traditional model considers hyperinsulinemia a compensatory response to insulin resistance, followed by the progressive failure of β-cells. An alternative hypothesis proposes instead that excessive insulin secretion may initially contribute to the development of resistance. By examining clinical, genetic, experimental, and pharmacological studies, a review concluded that the available evidence predominantly supports the presence of early β-cell dysfunction as the main determinant of dysglycemia, while acknowledging possible heterogeneity among individuals and clinical subgroups (Esser et al., 2020) [24].

Overall, the rise in glycemia becomes evident when insulin secretion is no longer adequate for metabolic demand. Glycemia can therefore be considered a mirror, often a late one, of residual pancreatic capacity. Its increase while fasting, after one hour, or after two hours from a load does not only indicate that more glucose has remained in circulation, but suggests that the compensation system has already begun to lose efficacy. For this reason, formally normal values do not necessarily guarantee the integrity of β-cells, just as elevated insulinemia does not automatically demonstrate efficient pancreatic function. Prevention should therefore intervene before overt hyperglycemia, by reducing the metabolic load and preserving the adaptive capacity of β-cells for as long as possible.

β-cell variability and function

Available evidence suggests that it is not only the extent of hyperglycemia that influences the fate of pancreatic β-cells, but also the way in which glucose levels fluctuate over time. For many years, the focus was primarily on mean glycemia and glycated hemoglobin, which were considered the main indicators of metabolic control. In recent years, however, numerous studies have shown that glycemic variability is a biologically active factor capable of exerting direct effects on the survival and function of β-cells. In other words, with the same mean glycemia, exposure characterized by continuous spikes and rapid drops in glucose appears to be more harmful than a relatively stable, albeit elevated, condition.

This hypothesis is also confirmed in humans. In a study conducted on 209 Chinese subjects with normal glucose tolerance, glycemic variability during an oral glucose tolerance test was inversely associated with β-cell function, as assessed by the disposition index corrected for insulin sensitivity. Individuals with the greatest glycemic fluctuations showed higher concentrations of TNF-α (a signaling molecule that promotes and coordinates inflammation) and markers of oxidative stress, as well as a significant reduction in β-cell function. These associations were observable even though all participants still fell within the category of normal glucose tolerance, suggesting that glycemic variability may contribute early on to the functional deterioration of β-cells through the activation of inflammatory and oxidative processes (Ma et al., 2021) [25].

Experimental evidence further reinforces this interpretation. Several studies have directly compared the effects of constant hyperglycemia with those of intermittent hyperglycemia on INS-1 pancreatic β-cells, using substantially equivalent mean glucose concentrations. In all experimental models, both conditions induced glucotoxicity, but glycemic fluctuations caused significantly greater damage. Apoptosis (the process of programmed cell death) was consistently higher, cell viability decreased more, and glucose-stimulated insulin secretion appeared more impaired compared to cells maintained in continuous hyperglycemia (Kim et al., 2010) [26]; (Shi et al., 2011) [27]; (Kim et al., 2012) [28]; (Shao et al., 2015) [29].

The mechanism common to these studies is oxidative stress. Glycemic fluctuations increase the intracellular production of reactive oxygen species (ROS) to a greater extent than stable hyperglycemia, leading to an increase in lipid peroxidation (a process of oxidative damage to lipids), documented by the increase in malondialdehyde (MDA, a molecule that forms during lipid peroxidation), and a simultaneous consumption of antioxidant defenses, evidenced by the reduction of glutathione (GSH, one of the main antioxidants produced naturally by the body) (Shi et al., 2011) [27]; (Zhang et al., 2014) [30]; (Shao et al., 2015) [29].

Furthermore, the damage does not only concern the survival of β-cells, but also their ability to regenerate. Intermittent hyperglycemia, in fact, induces cell cycle arrest: this results in a simultaneous reduction in proliferation and an increase in apoptosis, two processes that favor the progressive loss of pancreatic β-cell mass (Zhang et al., 2014) [30].

Overall, this evidence indicates that glycemic variability is a direct determinant of pancreatic β-cell health. Continuous glucose fluctuations do not merely accompany the progression of diabetes, but appear to actively contribute to the deterioration of secretory function and the loss of β-cell mass through the activation of oxidative stress, inflammation, and multiple pro-apoptotic pathways. From this perspective, preserving glycemic stability takes on a significance that goes beyond simple control of mean glycemia: it means reducing one of the main stimuli that promote the progressive functional exhaustion of the pancreas.

Insulin clearance

The concentration of insulin in the blood, as we saw in the previous chapter, is commonly interpreted as a direct consequence of the amount of hormone secreted by pancreatic β-cells. In reality, it is the result of the balance between two distinct but closely integrated processes: on one hand, pancreatic secretion, and on the other, the rate at which insulin is removed before entering circulation. This latter process is called insulin clearance and constitutes one of the main determinants of metabolic homeostasis. After being released into the portal vein, insulin first reaches the liver, which is its primary organ of elimination. Under physiological conditions, the first hepatic pass removes a very significant portion of the hormone, thereby regulating the amount that reaches systemic circulation and, consequently, muscle, adipose tissue, and other target organs (Tillil et al., 1988) [31]; (Meier et al., 2005) [32].

To understand the importance of this mechanism, it is useful to imagine the liver as an extremely sophisticated filter. Every molecule of insulin secreted by the pancreas must pass through it before reaching the rest of the body. The liver does not eliminate a fixed amount of the hormone but continuously modulates its activity based on metabolic needs. As early as the 1980s, it was demonstrated that insulin clearance is not a static parameter: as the glucose load increases, pancreatic secretion rises, but at the same time, the rate at which insulin is removed by the liver decreases. This adaptation allows for the maintenance of sufficiently high systemic insulin concentrations during periods of greater glucose availability, regardless of whether the glucose is taken orally or administered intravenously. In other words, the body simultaneously regulates both the production and elimination of the hormone to maintain optimal control of glycemia (Tillil et al., 1988) [31].

The regulation of clearance also depends on the specific way the pancreas secretes insulin. Contrary to what one might imagine, the hormone is not released continuously, but through rhythmic pulses that occur every few minutes. Studies conducted via direct sampling of the hepatic vein have shown that approximately 80% of secreted insulin is extracted during the first pass through the liver and that the liver modifies its extraction capacity almost instantaneously, following the rhythm of pancreatic secretion. What changes during an increase in glycemia is not so much the frequency of the pulses, but their amplitude: each "burst" contains a larger amount of insulin, and the mass of these pulses represents the main determinant of hepatic clearance. This reveals a very close functional integration between the pancreas and the liver, in which the latter does not play the simple role of an organ dedicated to insulin degradation, but acts as a true regulator of the hormone's distribution throughout the entire body (Meier et al., 2005) [32].

For many years, the reduction of insulin clearance was considered exclusively a compensatory response to insulin resistance. According to this interpretation, when tissues become less sensitive to the action of insulin, the body reduces its elimination to maintain high circulating concentrations and compensate for the reduced biological efficacy of the hormone. In recent years, however, this view has been profoundly re-evaluated. Numerous experimental and clinical findings suggest an opposite perspective: reduced clearance could represent one of the initial events in metabolic pathogenesis, preceding the onset of insulin resistance. In this model, lower hepatic elimination leads to chronic exposure of peripheral tissues to high concentrations of insulin. Persistent hyperinsulinemia would progressively alter insulin signaling: this mechanism could explain the simultaneous presence of reduced glucose utilization and persistent lipid synthesis observed in type 2 diabetes (Watada and Tamura, 2017) [33]; (Bergman et al., 2019) [34].

Experimental observations further reinforce this new paradigm. In a large study conducted on ninety metabolically healthy dogs, metabolic insulin clearance was found to be the main determinant of insulin sensitivity, even surpassing the contribution of adiposity and insulin secretion. Animals characterized by lower clearance had higher basal insulin concentrations and significantly reduced insulin sensitivity, while the secretory response of β-cells was not an independent predictor of insulin resistance. The authors therefore proposed that reduced insulin elimination induces chronic hyperinsulinemia, which continuously exposes peripheral tissues to the hormone, progressively promoting desensitization. This model overturns the traditional paradigm, suggesting that the reduction in clearance may precede and directly contribute to the development of insulin resistance, rather than simply representing a consequence of it (Ader et al., 2014) [35].

Clinical evidence in humans is equally convincing. In a prospective cohort including 570 Native American adults initially free of diabetes and followed for nearly eight years, reduced metabolic insulin clearance was associated with greater adiposity, fasting hyperinsulinemia, increased compensatory secretion, and reduced insulin sensitivity. More importantly, the decrease in clearance proved to be an independent predictor of the onset of type 2 diabetes even after adjustment for adiposity, insulin secretion, insulin sensitivity, and other metabolic risk factors. Subjects with the lowest capacity to eliminate insulin therefore had a significantly higher probability of developing the disease in subsequent years. Furthermore, the association observed with high levels of alanine aminotransferase (an enzyme used as an indicator of possible liver cell damage) suggests that fatty liver may compromise insulin extraction, further contributing to chronic hyperinsulinemia (Shah et al., 2021) [36].

Ethnic differences observed in numerous populations also seem to confirm the central role of insulin clearance. Systematic reviews dedicated to African populations have highlighted that peripheral insulin levels are frequently higher than those observed in European populations. However, when secretion is assessed through C-peptide measurement, which allows for the distinction between pancreatic production and hepatic elimination, it emerges that much of the hyperinsulinemia can be explained by reduced insulin extraction rather than actual hypersecretion by β-cells. In sub-Saharan African populations, a pathophysiological model has even been proposed in which hyperinsulinemia, sustained by the combination of increased secretion and reduced hepatic clearance, represents the initial event that precedes obesity, insulin resistance, and subsequent deterioration of β-cell function. These observations indicate how insulin clearance can represent an important determinant of individual susceptibility to diabetes, helping to explain part of the metabolic differences observed between different ethnic groups (Ladwa et al., 2019) [37]; (Goedecke and Mendham, 2022) [38].

The importance of insulin clearance also emerges clearly in some specific clinical conditions. In women affected by polycystic ovary syndrome, for example, marked hyperinsulinemia has traditionally been attributed exclusively to insulin resistance. However, when comparing women with PCOS and women with prediabetes who were carefully matched for age and body mass index, it emerged that peripheral insulin sensitivity was substantially similar in the two groups. The main difference lay in the capacity to eliminate insulin: patients with PCOS had significantly reduced metabolic clearance, which was closely correlated with the levels of hyperinsulinemia observed during the oral glucose tolerance test. This suggests that the excess circulating insulin depends to a large extent on altered hormone elimination and not exclusively on increased pancreatic secretion (Amato et al., 2015) [39].

Taken together, these findings indicate that insulin clearance represents much more than a simple hormone elimination mechanism. It constitutes one of the main regulators of tissue exposure to insulin and contributes significantly to metabolic physiology. Its reduction can lead to chronic hyperinsulinemia even in the absence of significant pancreatic hypersecretion, favoring the onset of insulin resistance over time and increasing the risk of type 2 diabetes. The concentration of insulin in the blood, therefore, should never be interpreted exclusively as an index of β-cell function, but as the result of the dynamic interaction between pancreatic secretion and hepatic clearance. Understanding this balance means profoundly changing the way we interpret the origin of hyperinsulinemia and, consequently, the pathophysiology of type 2 diabetes itself.

Insulin clearance and hyperinsulinemia

Hyperinsulinemia is often interpreted as the direct result of increased insulin secretion by pancreatic β-cells. This explanation, however, is incomplete. The concentration of the hormone in the blood actually depends on the balance between the amount secreted and the rate at which it is cleared, primarily by the liver. Consequently, high insulin levels can result from increased pancreatic production, reduced clearance, or a variable combination of both processes. This distinction is fundamental because the two conditions do not necessarily describe the same metabolic phase or the same pathophysiological mechanism.

The complexity becomes clear when observing fasting insulin, often used as an indirect indicator of insulin resistance. In a cohort of 470 Hispanic-American subjects, its concentration was found to be independently influenced by insulin metabolic clearance, insulin sensitivity, BMI, waist circumference, and fasting glycemia. Among all these factors, clearance showed the strongest quantitative association, even greater than that of insulin sensitivity. The parameters considered explained approximately 52% of the variability in fasting insulin levels, demonstrating that this value cannot be automatically interpreted as a measure of insulin resistance alone (Goodarzi et al., 2011) [40].

The ability to clear insulin also varies considerably under seemingly physiological conditions. In an experimental study that directly measured first-pass hepatic extraction, the proportion of insulin removed by the liver ranged from 22.4% to 77.2%, with an average of about 50%. Greater hepatic extraction was associated with better insulin sensitivity, while lower extraction corresponded to higher fasting insulin concentrations. The wide dispersion observed among healthy subjects suggests that clearance represents a highly individual physiological characteristic, likely influenced by genetic, environmental, and metabolic factors (Asare-Bediako et al., 2018) [41].

This variability can acquire pathological significance as early as the very first stages of weight gain. In ten healthy men subjected to an intentional increase of two BMI points, from 21.8 to 23.8 kg/m2, insulin levels and insulin resistance increased even though body weight remained within the range considered normal. Basal hyperinsulinemia was certainly dependent on a modest increase in secretion but, above all, on a reduction in clearance. After a meal, an oral glucose load, or intravenous stimulation, however, the increase in insulin was entirely explained by the lower elimination of the hormone, as C-peptide and pancreatic secretion remained substantially unchanged. This indicates that reduced clearance may represent one of the first metabolic adaptations to an increase in adipose mass, preceding the marked hypersecretion typical of overt obesity (Erdmann et al., 2008) [42].

The relative contribution of secretion and clearance, however, does not remain constant, but changes as a function of the degree of adiposity and metabolic condition. In 291 subjects divided by BMI classes, fasting hyperinsulinemia increased progressively with body weight and was supported primarily by increased secretion, while the reduction in clearance provided a more limited contribution. After a meal, however, secretion increased only in overweight subjects and did not grow further in those with obesity. In the latter, the further increase in circulating insulin depended mainly on the progressive decrease in clearance. In parallel, the postprandial glycemic response worsened with increasing BMI, suggesting that high insulin levels were no longer sufficient to fully compensate for the loss of sensitivity (Erdmann et al., 2009) [43].

More recent studies have further reinforced the hypothesis that reduced clearance may constitute an initial event in hyperinsulinemia associated with obesity. In two independent cohorts, comprising over five hundred participants in total, all subjects with obesity presented a decrease in insulin clearance, which was progressively more marked as insulin resistance increased. In the early levels of metabolic impairment, however, secretion remained substantially unchanged. The increase in circulating insulin therefore did not seem to necessarily require greater pancreatic production, but certainly resulted from a reduction in clearance (Fu et al., 2022) [44].

When type 2 diabetes appears, the interaction between secretion and clearance becomes even more complex. In 348 patients with diabetes, basal insulin was generally higher compared to controls, but this increase depended primarily on the reduction in clearance and not on greater secretion. In the postprandial period, by contrast, insulin concentrations were lower and did not increase in relation to BMI as they did in non-diabetic subjects. As the disease progressed, the early secretory response decreased progressively, reflecting the deterioration of β-cells. Late secretion could instead increase considerably, but it was counterbalanced by an increase in clearance, so that peripheral insulin did not fully reflect the amount actually secreted (Erdmann et al., 2012) [45].

These observations show why the simple measurement of plasma insulin can be misleading. A high concentration does not necessarily demonstrate hypersecretion, just as a relatively low value does not exclude an intense pancreatic response if the hormone is cleared rapidly. To understand the origin of hyperinsulinemia, it is therefore necessary to distinguish the contribution of secretion from that of clearance.

The liver occupies a central position in this balance: in patients with simple hepatic steatosis or non-alcoholic steatohepatitis, hepatic insulin clearance was reduced by approximately 30% compared to subjects without hepatic fat accumulation. The impairment was already present in simple steatosis and did not worsen in relation to the severity of fibrosis and inflammation, suggesting that the hepatic defect appears early with the accumulation of lipids. Systemic clearance, however, decreased progressively with the worsening of inflammation and cellular damage. Since insulin secretion did not differ significantly between simple and non-alcoholic steatosis, hyperinsulinemia was more associated with the reduced elimination of the hormone than with an increase in its production (Bril et al., 2014) [46].

In another study on a Portuguese cohort, “PREVADIAB2”, including 1,019 participants, the transition from normoglycemia to prediabetes and type 2 diabetes was accompanied by a progressive increase in BMI, insulin resistance, insulin levels, and hepatic steatosis. Subjects with the worst metabolic profile simultaneously showed a lower ability to clear insulin. The correlation was particularly evident in normoglycemic and less compromised subjects (Patarrão et al., 2024) [47].

The possible causal relationship between reduced clearance and hyperinsulinemia has also been investigated using animal models which, as early as two months of age, presented a marked decrease in hepatic insulin elimination and hyperinsulinemia, in the absence of obesity, steatosis, increased lipolysis, or systemic insulin resistance. Only in the following months did a reduction in the insulin receptor, hepatic insulin resistance, and steatosis appear. The observed temporal sequence therefore places the reduction in clearance and the resulting hyperinsulinemia at the beginning of the cascade, before the main alterations traditionally considered responsible for insulin resistance (Ghadieh et al., 2019) [48].

Overall, these findings show that hyperinsulinemia does not constitute a single phenomenon nor can it be automatically attributed to excessive β-cell activity. In the early stages of weight gain, the decrease in clearance can precede hypersecretion and increase systemic exposure to insulin. With increasing obesity and insulin resistance, secretion and clearance can contribute to different degrees in the basal state and after meals. Finally, in advanced stages of diabetes, the deterioration of β-cell function further modifies this balance. Reduced insulin clearance should therefore not be considered merely a compensatory response, but a possible initial regulator of hyperinsulinemia and, in some conditions, one of the mechanisms capable of favoring the subsequent appearance of insulin resistance.

Hyperinsulinemia and insulin resistance

For many years, hyperinsulinemia was interpreted almost exclusively as a compensatory response to insulin resistance: when tissues become less sensitive to the action of insulin, pancreatic β-cells increase the secretion of the hormone to keep glycemia within normal limits. This explanation retains a significant degree of validity, but it does not fully describe the relationship between the two phenomena. Experimental evidence shows, in fact, that prolonged exposure to high concentrations of insulin can, in turn, reduce the ability of tissues to respond to the hormone. Hyperinsulinemia and insulin resistance should therefore not be considered as two events necessarily arranged in a rigid sequence, but as components of a self-reinforcing circuit: the increase in insulin may initially support glycemic control, but over time it can contribute to the progressive desensitization of target tissues.

One of the most significant demonstrations comes from a study conducted on young, healthy subjects in whom physiological hyperinsulinemia was induced for 72–96 hours while maintaining normal glycemia. After a few days, systemic glucose utilization was reduced by 20–40%. The defect did not concern glucose utilization, which remained substantially within normoglycemic parameters, but rather its use for energy purposes, specifically its transformation and storage as glycogen (the body's glucose reserve). The ability of insulin to suppress hepatic glucose production also remained preserved, indicating that the initial alteration primarily affected peripheral tissues, particularly skeletal muscle. Isolated hyperinsulinemia also reduced the subsequent secretory response of β-cells to a hyperglycemic stimulus. When, however, elevated insulin was associated with mild chronic hyperglycemia, the pancreatic response increased significantly, but the selective defect in glycogen synthesis persisted. These data demonstrate that a persistently high concentration of insulin can directly induce insulin resistance even in initially healthy individuals (Del Prato et al., 1994) [49].

Human muscle cells cultured in vitro confirm this model. After three days of prolonged exposure to insulin, subsequent acute stimulation resulted in significantly lower glucose uptake. In parallel, the phosphorylation of IRS-1 and AKT decreased—two essential steps in the insulin cascade, which we will see in the following chapter. The reduction of TNF-α (a molecule that promotes the body's inflammatory response) and the absence of significant changes in various lipid and mitochondrial genes further indicated that hyperinsulinemia, on its own, was sufficient to induce insulin resistance without reproducing the entire inflammatory and lipotoxic environment of diabetes (Turner et al., 2020) [50].

Desensitization can begin at the level of the insulin receptor itself. Chronic exposure to the hormone reduces the receptor's ability to autophosphorylate (initiating signal transmission within the cell) after a new stimulation, even without necessarily decreasing the number of receptors present on the cell membrane. After temporary removal of the insulin, the structure and autophosphorylation appeared to return to normal; however, a subsequent brief exposure rapidly restored the resistant phenotype. This behavior suggests the existence of a sort of molecular memory of hyperinsulinemia, through which the receptor remains predisposed to respond inadequately even after the temporary disappearance of the chronic stimulus (Catalano et al., 2014) [51].

In other contexts, hyperinsulinemia not only modifies receptor functionality but also reduces its expression. A meta-analysis including over 450 human skeletal muscle samples highlighted an inverse relationship between fasting insulin and INSR mRNA expression (the gene containing the information necessary to produce the insulin receptor). In myotubes (immature cells that will give rise to muscle fibers) subjected to chronic insulin exposure, the INSR gene, the total amount of receptor protein, and the portion present on the cell surface decreased. Simultaneously, AKT phosphorylation and glucose uptake were attenuated. Some of these alterations persisted even after several hours of insulin removal. Chronic excess insulin can therefore reprogram the expression of the main components of its own signaling pathway, progressively reducing the cell's ability to perceive the hormone (Cen et al., 2022) [52].

A similar process was observed in Hep G2 liver cells. After sixteen hours of insulin exposure, the amount of receptor decreased in a dose-dependent manner. The functional alterations, however, were even more marked: receptor phosphorylation dropped to 22%, and the interaction between IRS-1 and PI3K (two essential steps in the insulin cascade) was reduced by 66%. The amount of PI3K remained unchanged, indicating that the problem was not a lack of the enzyme, but an inability to recruit it correctly into the signaling complex. Hyperinsulinemia therefore simultaneously compromised the receptor, IRS-1, and the transition to PI3K, interrupting the cascade in its very early stages (Yuan et al., 2002) [53].

A further form of insulin resistance has been observed in cerebral microvascular endothelial cells. In this case, the total number of receptors increased, but their functionality decreased: autophosphorylation was compromised, a greater portion remained blocked on the membrane, and internalization after insulin stimulation was reduced. Inhibition restored receptor phosphorylation, signaling, and internalization. Such alterations could reduce insulin transport across the blood-brain barrier (a selective filter that protects the brain from potentially harmful substances) and contribute to the cerebral insulin resistance associated with obesity (Watson et al., 2022) [54].

Overall, the evidence shows that chronic hyperinsulinemia can act on multiple levels: it modifies the conformation and autophosphorylation of the receptor, reduces its expression or accelerates its degradation, alters IRS-1 and PI3K recruitment, attenuates AKT, and compromises glucose transport and storage. These effects involve muscle, liver, adipose tissue, kidney, and cerebral endothelium, although they assume different characteristics in different tissues.

Thus, a pathophysiological vicious cycle emerges: reduced insulin clearance or increased secretion initially increases systemic exposure to the hormone; persistent stimulation progressively induces insulin resistance; the reduced effectiveness of insulin makes it necessary to maintain even higher hormone concentrations to control glycemia; the further hyperinsulinemia amplifies the desensitization mechanisms. In this perspective, hyperinsulinemia does not only represent the body's attempt to compensate for an existing defect, but can become one of the factors that sustain and accelerate its progression.

Conclusions

Taken together, the scientific evidence analyzed in this chapter shows how metabolic deterioration can begin long before the onset of overt hyperglycemia. The first sign may be represented by glycemic variability: progressively wider glucose fluctuations appear as early as the transition from normal tolerance to prediabetes and increase further in type 2 diabetes. Continuous monitoring has allowed for the quantification of this instability through parameters such as SD, CV, MAGE, MODD, and CONGA, also showing how greater variability can precede a diabetes diagnosis and be associated with oxidative stress, inflammation, endothelial dysfunction, and an increased risk of microvascular and macrovascular complications. In this context, postprandial excursions are of particular importance, as they can become evident while fasting glycemia is still normal. Specifically, high blood glucose one hour after an OGTT identifies apparently normotolerant individuals who already exhibit impaired β-cell function and, in some cases, insulin sensitivity.

The next step therefore concerns the pancreatic β-cells: research shows that their deterioration does not begin suddenly with diabetes, but can be recognized along the entire glycemic continuum, even within values considered normal. Glycemia tends to increase when insulin secretion can no longer adequately adapt to metabolic demand; for this reason, the absolute amount of insulin is not sufficient to describe pancreatic function and must be interpreted in relation to insulin sensitivity, through parameters such as the disposition index. Evidence also shows that glucose oscillations can contribute directly to β-cell deterioration: compared to stable hyperglycemia, intermittent exposure increases oxidative stress, ROS production, lipid peroxidation, and apoptosis to a greater extent, while simultaneously reducing the viability, proliferation, and secretory capacity of β-cells.

The amount of insulin present in circulation, however, does not depend solely on how much the pancreas produces. A further fundamental step is represented by insulin clearance, especially hepatic. The liver removes a significant portion of insulin during the first pass and dynamically modifies this extraction in relation to pancreatic secretion and metabolic needs. The evidence analyzed indicates that a reduction in clearance can appear early, increasing the residence time of insulin in the blood even without a corresponding pancreatic hypersecretion. This alteration has been associated with adiposity, hepatic steatosis, reduced insulin sensitivity, and the future development of type 2 diabetes.

This leads to a different interpretation of hyperinsulinemia: elevated insulin concentrations do not necessarily indicate a pancreas producing excessive amounts, because they can result from increased secretion, decreased elimination, or a combination of the two phenomena. In the early stages of weight gain and metabolic alteration, some research shows that reduced clearance can precede significant hypersecretion, while with the progression of obesity, insulin resistance, and finally diabetes, the relative contribution of the two processes changes continuously.

The final step concerns the relationship between hyperinsulinemia and insulin resistance. The traditional model, in which insulin resistance determines a compensatory increase in insulin, remains valid but only in specific pathophysiological contexts, as it does not appear sufficient to describe all observed conditions. Experimental studies in humans and cellular models show, in fact, that elevated and persistent insulin exposure can itself progressively reduce the response to the hormone. Chronic hyperinsulinemia can impair autophosphorylation and insulin receptor expression, alter IRS-1 and PI3K recruitment, attenuate AKT, and reduce glucose uptake and storage.

Thus, a potentially self-reinforcing pathophysiological circuit emerges: reduced clearance or increased secretion can initially increase systemic insulin exposure; persistent stimulation can promote tissue desensitization; the lower efficacy of the hormone requires even higher insulin concentrations to maintain glycemic control, while in parallel, β-cell function can progressively deteriorate and glycemic variability increase. Glycemic variability, β-cell function, clearance, hyperinsulinemia, and insulin resistance therefore emerge not as isolated phenomena, but as closely interconnected and sequential components of the same dynamic process, the understanding of which allows for shifting the focus from overt hyperglycemia alone to the metabolic alterations that can precede it by many years.

References

[1] Contributions of Preprandial and Postprandial Glucose Exposures, Glycemic Variability, and Non-Glycemic Factors to HbA1c in People with and without Diabetes

Færch et al., 2018

Nutrition & Diabetes, 2018; 8:38.

[2] Glucose Fluctuations in Subjects with Normal Glucose Tolerance, Impaired Glucose Regulation and Newly Diagnosed Type 2 Diabetes Mellitus

Wang et al., 2012

Clinical Endocrinology, 2012; 76(6):810–815.

[3] The Rationale for Pre- and Postprandial Blood Glucose Monitoring: The Role of Glycemic Variability in Micro- and Macrovascular Risk

Gerich, 2007

Current Medical Research and Opinion, 2007; 23(8):1791–1798.

[4] Dietary Modification with Food Order and Split Carbohydrate Intake Improves Glycemic Excursions in Healthy Young Women

Higuchi et al., 2025

Nutrients, 2025; 17(20):3194.

[5] Optimizing Glycemic Variability in Type 2 Diabetes through Simple Dietary and Culinary Recommendations to Modulate Starch Digestibility: A Randomized Controlled Trial

Chisbert et al., 2025

The American Journal of Clinical Nutrition, 2025; 122(6):1591–1601.

[6] Continuous Glucose Monitoring Glycemic Variability Parameters as Predictors of Diabetes: A Prospective Evaluation in a General Non-Diabetic Population

Rodríguez García et al., 2025

Advances in Laboratory Medicine, 2025; 6(1):46–51.

[7] Glycemic Variability: How Do We Measure It and Why Is It Important?

Suh e Kim, 2015

Diabetes & Metabolism Journal, 2015; 39(4):273–282.

[8] Glycemic Variability: Adverse Clinical Outcomes and How to Improve It?

Zhou et al., 2020

Cardiovascular Diabetology, 2020;19(1):102.

[9] Glycemic Variability in Relation to Oral Disposition Index in Subjects with Different Stages of Glucose Tolerance

Chen et al., 2013

Diabetology & Metabolic Syndrome, 2013; 5:38.

[10] Glucose Variability: A Review of Clinical Applications and Research Developments

Rodbard, 2018

Diabetes Technology & Therapeutics, 2018; 20(Suppl. 2):S25–S215.

[11] One-Hour Plasma Glucose Concentration During the OGTT: What Does It Tell About β-Cell Function Relative to Insulin Sensitivity in Overweight/Obese Children?

Tfayli et al., 2011

Pediatric Diabetes, 2011; 12(6):572–579.

[12] Normal Glucose Tolerance with a High 1-Hour Postload Plasma Glucose Level Exhibits Decreased β-Cell Function Similar to Impaired Glucose Tolerance

Oh et al., 2015

Diabetes & Metabolism Journal, 2015; 39(2):147–153.

[13] Elevated 1-Hour Plasma Glucose Levels Are Associated with Dysglycemia, Impaired β-Cell Function and Insulin Sensitivity: Pilot Study from a Real-World Health Care Setting

Jagannathan et al., 2016

Endocrine, 2016; 52(1):172–175.

[14] Relationship Between Glycemic Variability, Hemoglobin A1c, and Mean Glucose in Phase 3 Clinical Trials Among Patients with Type 1 and Type 2 Diabetes

Luo et al., 2018

Journal of Diabetes Science and Technology, 2018; 12(2):325–332.

[15] Insulin Resistance and β-Cell Dysfunction in Individuals with Normal Glucose Tolerance but Elevated 1-Hour Plasma Glucose After Oral Glucose Load

Nie et al., 2025

Frontiers in Endocrinology, 2025; 16:1507107.

[16] Postprandial Glycemic Profiles Can Reflect Heterogeneity in Insulin Secretion and Insulin Sensitivity in Type 2 Diabetes

Giosuè et al., 2026

Metabolism, 2026; 181:156626.

[17] Beta-Cell Dysfunction and Glucose Intolerance: Results from the San Antonio Metabolism (SAM) Study

Gastaldelli et al., 2004

Diabetologia, 2004; 47(1):31–39.

[18] The Normal Glucose Tolerance Continuum in Obese Youth: Evidence for Impairment in β-Cell Function Independent of Insulin Resistance

Yeckel et al., 2005

The Journal of Clinical Endocrinology & Metabolism, 2005; 90(2):747–754.

[19] The Relationship Between Fasting Hyperglycemia and Insulin Secretion in Subjects with Normal or Impaired Glucose Tolerance

Abdul-Ghani et al., 2008

American Journal of Physiology-Endocrinology and Metabolism, 2008; 295(2)–E406.

[20] Pancreatic β-Cell Dysfunction in Normoglycemic Patients and Risk Factors

Vilchis-Flores et al., 2019

Acta Diabetologica, 2019; 56(12):1305–1314.

[21] Evidence of Reduced β-Cell Function in Asian Indians with Mild Dysglycemia

Staimez et al., 2013

Diabetes Care, 2013; 36(9):2772–2778.

[22] Associations of β-Cell Function and Insulin Resistance with Youth-Onset Type 2 Diabetes and Prediabetes Among Asian Indians

Mohan et al., 2013

Diabetes Technology & Therapeutics, 2013; 15(4):315–322.

[23] Deterioration of Beta Cell Function Is the Dominant Determinant of Progression from Normal Glucose Tolerance to Prediabetes/Diabetes in Young Women After Pregnancy

Retnakaran et al., 2023

Diabetologia, 2023; 66(11):2154–2163.

[24] Early Beta Cell Dysfunction Versus Insulin Hypersecretion as the Primary Event in the Pathogenesis of Dysglycaemia

Esser et al., 2020

Diabetologia, 2020; 63(10):2007–2021.

[25] Association Between Glucose Fluctuation During 2-h Oral Glucose Tolerance Test, Inflammatory Markers, Oxidative Stress and β-Cell Function in a Chinese Population with Normal Glucose Tolerance

Ma et al., 2021

Annals of Translational Medicine, 2021; 9(4):327.

[26] Effect of Glucose Fluctuation on Pancreatic Beta-Cell Apoptosis and Function

Kim et al., 2010

Korean Diabetes Journal, 2010; 34(1):47–54.

[27] Intermittent High Glucose Enhances Apoptosis in INS-1 Cells

Shi et al., 2011

Experimental Diabetes Research, 2011; 2011:754673.

[28] Enhanced Apoptosis of INS-1 Cells Under Glucose Fluctuation and the Involvement of FOXO-SIRT Pathway

Kim et al., 2012

Diabetes Research and Clinical Practice, 2012; 98(1):132–139.

[29] Systematic Investigation of the Role of Intermittent Hyperglycemia in Pancreatic Beta Cells

Shao et al., 2015

International Journal of Clinical and Experimental Medicine, 2015; 8(4):5462–5469. PMID: 26131124.

[30] Cytotoxic Effect of Intermittent High Glucose on Apoptosis and Cell Viability in Pancreatic Beta Cells

Zhang et al., 2014

Journal of Diabetes Research, 2014; 2014:712781.

[31] Reduction of Insulin Clearance During Hyperglycemia

Tillil et al., 1988

Diabetes, 1988; 37(10):1351–1357.

[32] Pulsatile Insulin Secretion Dictates Systemic Insulin Delivery by Regulating Hepatic Insulin Extraction in Humans

Meier et al., 2005

Diabetes, 2005; 54(6):1649–1656.

[33] Impaired Insulin Clearance as a Cause Rather than a Consequence of Insulin Resistance

Watada et al., 2017

Journal of Diabetes Investigation, 2017; 8(6):723–725.

[34] Hypothesis: Role of Reduced Hepatic Insulin Clearance in the Pathogenesis of Type 2 Diabetes

Bergman et al., 2019

Diabetes. 2019 Sep;68(9):1709-1716.

[35] Hepatic Insulin Clearance Is the Primary Determinant of Insulin Sensitivity in the Normal Dog

Ader et al., 2014

Obesity (Silver Spring), 2014; 22(5):1238–1245.

[36] Reduced Insulin Clearance Is Associated with Increased Risk of Type 2 Diabetes in Native Americans

Shah et al., 2021

Diabetologia, 2021; 64(4):914–922.

[37] A Systematic Review of Beta Cell Function in Adults of Black African Ethnicity

Ladwa et al., 2019

Journal of Diabetes Research, 2019; 2019:7891359.

[38] Pathophysiology of type 2 diabetes in sub-Saharan Africans

Goedecke e Mendham, 2022

Diabetologia. 2022 Dec;65(12):1967-1980.

[39] Hyperinsulinism and polycystic ovary syndrome (PCOS): role of insulin clearance

Amato et al., 2015

J Endocrinol Invest. 2015 Dec;38(12):1319-26.

[40] Fasting Insulin Reflects Heterogeneity in Predominant Pathophysiological Processes Underlying Glucose Intolerance: The Insulin Resistance Atherosclerosis Study (IRAS)

Goodarzi et al., 2011

Diabetes Care, 2011; 34(8):1824–1829.

[41] Variability in Directly Measured First-Pass Hepatic Insulin Extraction and Its Association with Insulin Sensitivity and Plasma Insulin

Asare-Bediako et al., 2018

Diabetes, 2018; 67(8):1495– 1503.

[42] Development of hyperinsulinemia and insulin resistance during the early stage of weight gain

Erdmann et al., 2008

Am J Physiol Endocrinol Metab. 2008 Mar;294(3):E568-75.

[43] Weight-dependent differential contribution of insulin secretion and clearance to hyperinsulinemia of obesity

Erdmann et al., 2009

Regul Pept. 2009 Jan 8;152(1-3):1-7.

[44] Impaired Insulin Clearance as the Initial Regulator of Obesity-Associated Hyperinsulinemia: Novel Insight Into the Underlying Mechanism Based on Serum Bile Acid Profiles

Fu et al., 2022

Diabetes Care. 2022 Feb 1;45(2):425-435.

[45] Disturbances of basal and postprandial insulin secretion and clearance in obese patients with type 2 diabetes mellitus

Erdmann et al., 2012

Horm Metab Res. 2012 Jan;44(1):60-9.

[46] Relationship between disease severity, hyperinsulinemia, and impaired insulin clearance in patients with nonalcoholic steatohepatitis

Bril et al., 2014

Hepatology. 2014 Jun;59(6):2178-87.

[47] Insights into circulating CEACAM1 in insulin clearance and disease progression: Evidence from the Portuguese PREVADIAB2 study

Patarrão et al., 2024

Eur J Clin Invest. 2024 Dec 14;54(Suppl 2):e14344.

[48] Hyperinsulinemia drives hepatic insulin resistance in male mice with liver-specific Ceacam1 deletion independently of lipolysis

Ghadieh et al., 2019

Metabolism. 2019 Apr:93:33-43.

[49] Effect of sustained physiologic hyperinsulinaemia and hyperglycaemia on insulin secretion and insulin sensitivity in man

Del Prato et al., 1994

Diabetologia. 1994 Oct;37(10):1025-35.

[50] Characterising hyperinsulinemia-induced insulin resistance in human skeletal muscle cells

Turner et al., 2020

J Mol Endocrinol. 2020 Apr;64(3):125-132.

[51] Insulin resistance induced by hyperinsulinemia coincides with a persistent alteration at the insulin receptor tyrosine kinase domain

Catalano et al., 2014

PLoS One. 2014 Sep 26;9(9):e108693.

[52] Human and mouse muscle transcriptomic analyses identify insulin receptor mRNA downregulation in hyperinsulinemia-associated insulin resistance

Cen et al., 2022

FASEB J. 2022 Jan;36(1):e22088.

[53] Chronic hyperinsulinism induced down-regulation of insulin post-receptor signaling transduction in Hep G2 cells

Yuan et al., 2002

J Huazhong Univ Sci Technolog Med Sci. 2002;22(4):313-6.

[54] Hyperinsulinemia alters insulin receptor presentation and internalization in brain microvascular endothelial cells

Watson et al., 2022

Diab Vasc Dis Res. 2022 Jul-Aug; 19 (4):14791641221118626.