
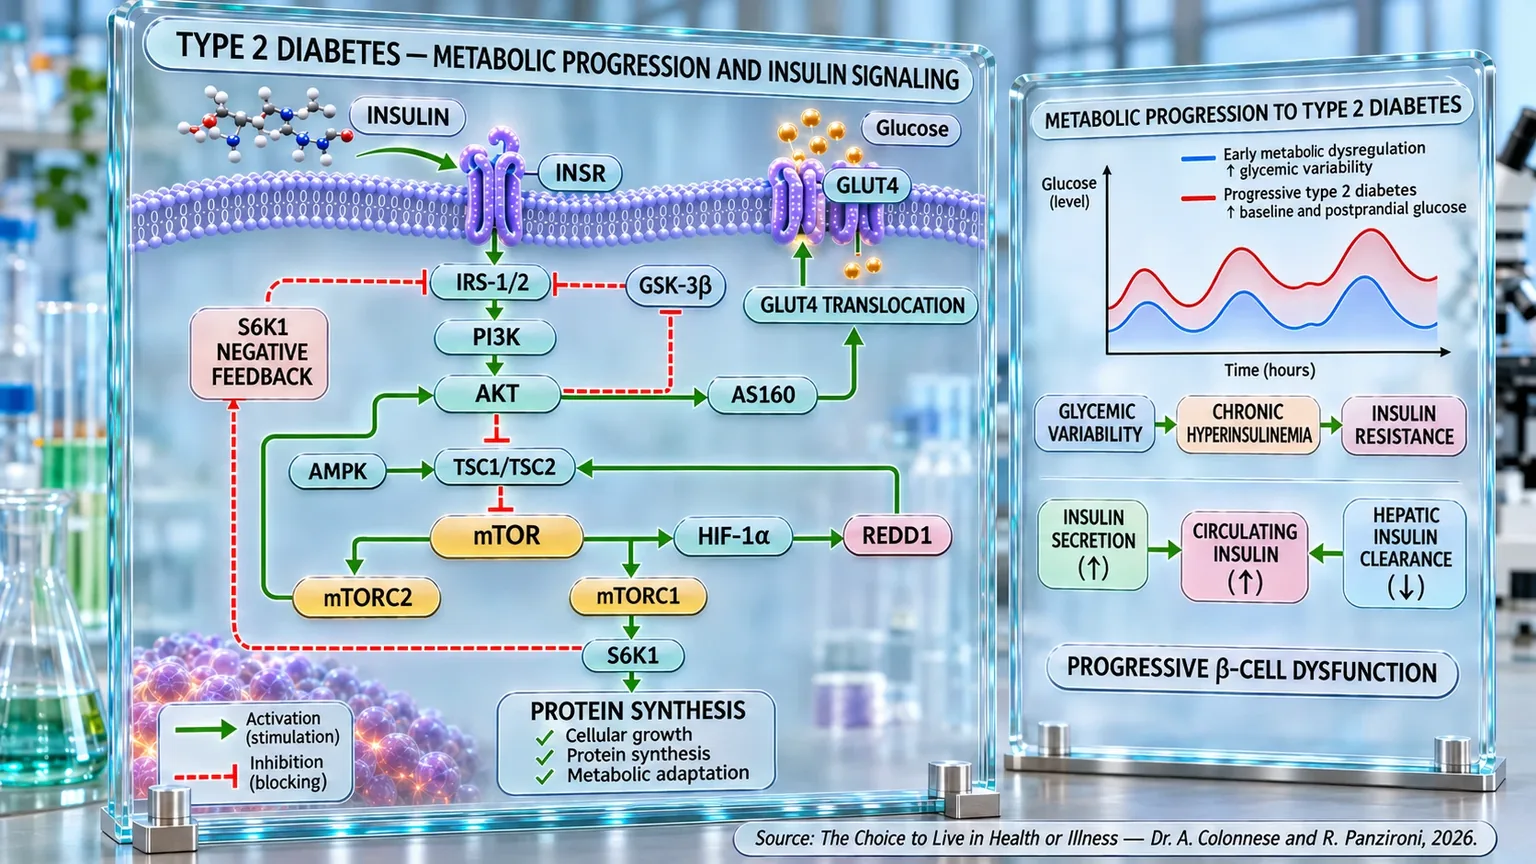
Over the years, type 2 diabetes has been described primarily through static values, such as fasting glycemia and glycated hemoglobin (HbA1c). For a long time, these parameters have been the pillars of diagnosis and disease monitoring, but they only capture a single moment or an average of glucose exposure over several months. It is somewhat like evaluating the traffic of an entire city by looking at a single photograph taken at an intersection: the image may be accurate at that precise moment, but it does not tell you how intense the traffic was, how much it varied throughout the day, or if sudden traffic jams occurred. Similarly, two people can have the same fasting glycemia or the same HbA1c while having completely different glycemic profiles. One may maintain relatively stable values throughout the day, while the other alternates between continuous postprandial spikes and rapid drops in glycemia. Today, we know that these very oscillations represent one of the most important aspects of the pathophysiology of diabetes, as they directly reflect the body's ability to maintain glucose homeostasis (Acciaroli et al., 2018) [11].
The introduction of Continuous Glucose Monitoring (CGM) systems has profoundly changed this perspective. Unlike traditional point-in-time measurements, CGM records thousands of glycemic values during normal daily life, allowing us to observe not only the average glycemic value but also its stability, the frequency of excursions, the duration of postprandial spikes, and the body's ability to quickly return glucose to physiological limits. This dynamic assessment has made it possible to understand that the deterioration of glucose metabolism does not appear suddenly when glycemia exceeds a certain threshold, but develops through a long process characterized by a progressive loss of glycemic stability, often many years before a diabetes diagnosis (Cichosz et al., 2025) [12].
One of the most important findings to emerge from recent studies is the demonstration that glycemic variability increases gradually along the entire metabolic continuum. By analyzing over eight hundred participants from five different clinical studies, it was observed that mean glucose increases progressively, moving from approximately 99 mg/dL in normoglycemic subjects to over 180 mg/dL in patients with poorly controlled diabetes. In parallel, the time spent above 140 mg/dL, the Mean Amplitude of Glycemic Excursions (MAGE), and numerous other variability indices increase, while the body's ability to quickly correct small glycemic oscillations progressively decreases. Even the complexity of the glycemic signal, an expression of an efficient regulatory system, reduces progressively as dysglycemia advances, indicating a loss of physiological balance that precedes the onset of overt diabetes (Cichosz et al., 2025) [12].
These observations explain why prediabetes (the alteration of glycemic regulation that precedes type 2 diabetes) can no longer be considered a simple phase characterized by a slight elevation in mean glycemia. Continuous monitoring shows that profound alterations in glucose regulation appear as early as this initial phase. In subjects carefully matched for age, sex, and body mass index, CGM has shown that people with prediabetes spend less time within the optimal glycemic range, have higher average values, and, above all, develop significantly greater oscillations compared to metabolically healthy subjects. Parameters such as the coefficient of variation (CV) and MAGE are already significantly increased, while the response to the glucose tolerance test shows higher glycemic exposure and slower normalization after the load. These results indicate that glycemic instability is one of the first signs of the loss of metabolic homeostasis and often precedes the stable increase in fasting glycemia or HbA1c (Rizos et al., 2024) [13].
This new vision also challenges one of the traditional principles of diabetes diagnosis: the idea that a single fasting glycemia measurement can faithfully represent a person's metabolic state. A large study conducted on over eight thousand non-diabetic adults has shown that fasting glycemia exhibits significant intra-individual variability, with daily oscillations exceeding 7 mg/dL. A variability of this magnitude is sufficient to cause the same individual, on different days, to shift from normoglycemia to the prediabetes or even diabetes range. It is therefore not surprising that about 40% of subjects initially classified as normoglycemic presented at least one subsequent measurement compatible with prediabetes, and that 3% even exceeded the diagnostic threshold for diabetes. Fasting glycemia thus appears as the final result of numerous physiological factors, including hepatic glucose production, basal insulin secretion, sleep, physical activity, dinner composition, the dawn phenomenon, and stress response, making it clear that a single value cannot describe the entire complexity of glucose metabolism (Shilo et al., 2024) [14].
Metrics derived from continuous monitoring, on the other hand, allow us to describe this complexity through numerous mathematical indices. Some measure how much glycemic values vary and deviate from their mean value during a given period, such as standard deviation and the coefficient of variation; others evaluate the magnitude of major glycemic excursions, such as MAGE; still others estimate the time spent above or within certain glycemic ranges or quantify the risk of hypoglycemia and hyperglycemia. Although there are dozens of different parameters, numerous studies show that only some of them are truly informative. Among these, the coefficient of variation emerges as one of the most robust indicators, while MAGE is likely the most sensitive metric for describing the loss of physiological control of glycemia, as it simultaneously integrates the magnitude of glycemic spikes and subsequent reductions (Acciaroli et al., 2018) [11]; (Zahalka et al., 2024) [15].
The importance of glycemic variability, however, is not limited to a simple description of metabolism. Glycemic oscillations seem to anticipate the development of overt diabetes by many years. The prospective AEGIS study, which followed nearly five hundred non-diabetic subjects for six years, demonstrated that those who later developed diabetes already exhibited significantly higher glycemic oscillations at the time of enrollment compared to participants who remained normoglycemic. Among all the parameters analyzed, the standard deviation of glycemia proved to be the best predictor of the future onset of the disease, reaching a very high discriminatory capacity. In other words, the loss of glycemic stability precedes the onset of diabetes and can be detected years before the disease becomes clinically evident (Rodríguez García et al., 2025) [16].
This predictive capacity likely stems from the fact that glycemic oscillations are not just a statistical phenomenon, but reflect well-defined biological processes. Repeated increases and reductions in glycemia promote the production of reactive oxygen species, increase oxidative stress, activate inflammatory pathways, impair endothelial function, and subject pancreatic β-cells to continuous functional overload. Glycemic variability thus becomes not only an early indicator of the disease, but also one of the possible mechanisms through which it progresses over time (Rodríguez García et al., 2025) [16].
A central role is played by glycemic responses after meals. While fasting glycemia primarily reflects hepatic glucose production and basal insulin secretion, the postprandial response simultaneously involves numerous physiological mechanisms: insulin secretion, peripheral insulin sensitivity, incretin activity (intestinal hormones that help the pancreas regulate glycemia), gastric emptying rate, intestinal absorption, and hepatic metabolism. A prospective study with nearly ten years of follow-up demonstrated that the area under the glycemic curve after a normal mixed meal is a powerful independent predictor of the future development of diabetes, maintaining its prognostic value even after correction for insulin sensitivity, insulin secretion, and body composition. This suggests that the body's ability to handle a real meal constitutes a much more complete measure of metabolic health than traditional diagnostic tests based exclusively on fasting glycemia or oral glucose tolerance (Mitchell et al., 2024) [17].
Continuous monitoring has also highlighted another aspect of extraordinary importance: different individuals can respond in profoundly different ways to the same food. By analyzing subjects who were carefully characterized from a metabolic standpoint, it was observed that some develop the greatest glycemic increase after consuming rice, others after bread, potatoes, or pasta. These differences do not depend solely on the food, but reflect specific metabolic phenotypes characterized by different levels of insulin resistance, β-cell functionality, lipid metabolism, gut microbiota composition, and distinct profiles. Even the effectiveness of simple nutritional strategies, such as the intake of fiber, protein, or fat before carbohydrates, varies considerably depending on the individual metabolic state, paving the way for true precision nutrition (Wu et al., 2025) [18].
Taken together, these findings are profoundly changing the way we interpret type 2 diabetes. The disease does not begin when glycemia exceeds a certain diagnostic threshold, but much earlier, when the body gradually loses the ability to keep glucose stable throughout the day. Glycemic variability therefore represents one of the first manifestations of metabolic deterioration, often invisible to traditional laboratory tests but clearly detectable through continuous monitoring. Although large-scale prospective studies are still needed to define shared diagnostic criteria, CGM is establishing itself as a tool capable not only of monitoring overt diabetes, but also of identifying at-risk subjects early, personalizing lifestyle interventions, and, potentially, modifying the natural history of the disease (Zahalka et al., 2025) [19].